- Name
- Jill Rosen
- jrosen@jhu.edu
- Office phone
- 443-997-9906
- Cell phone
- 443-547-8805
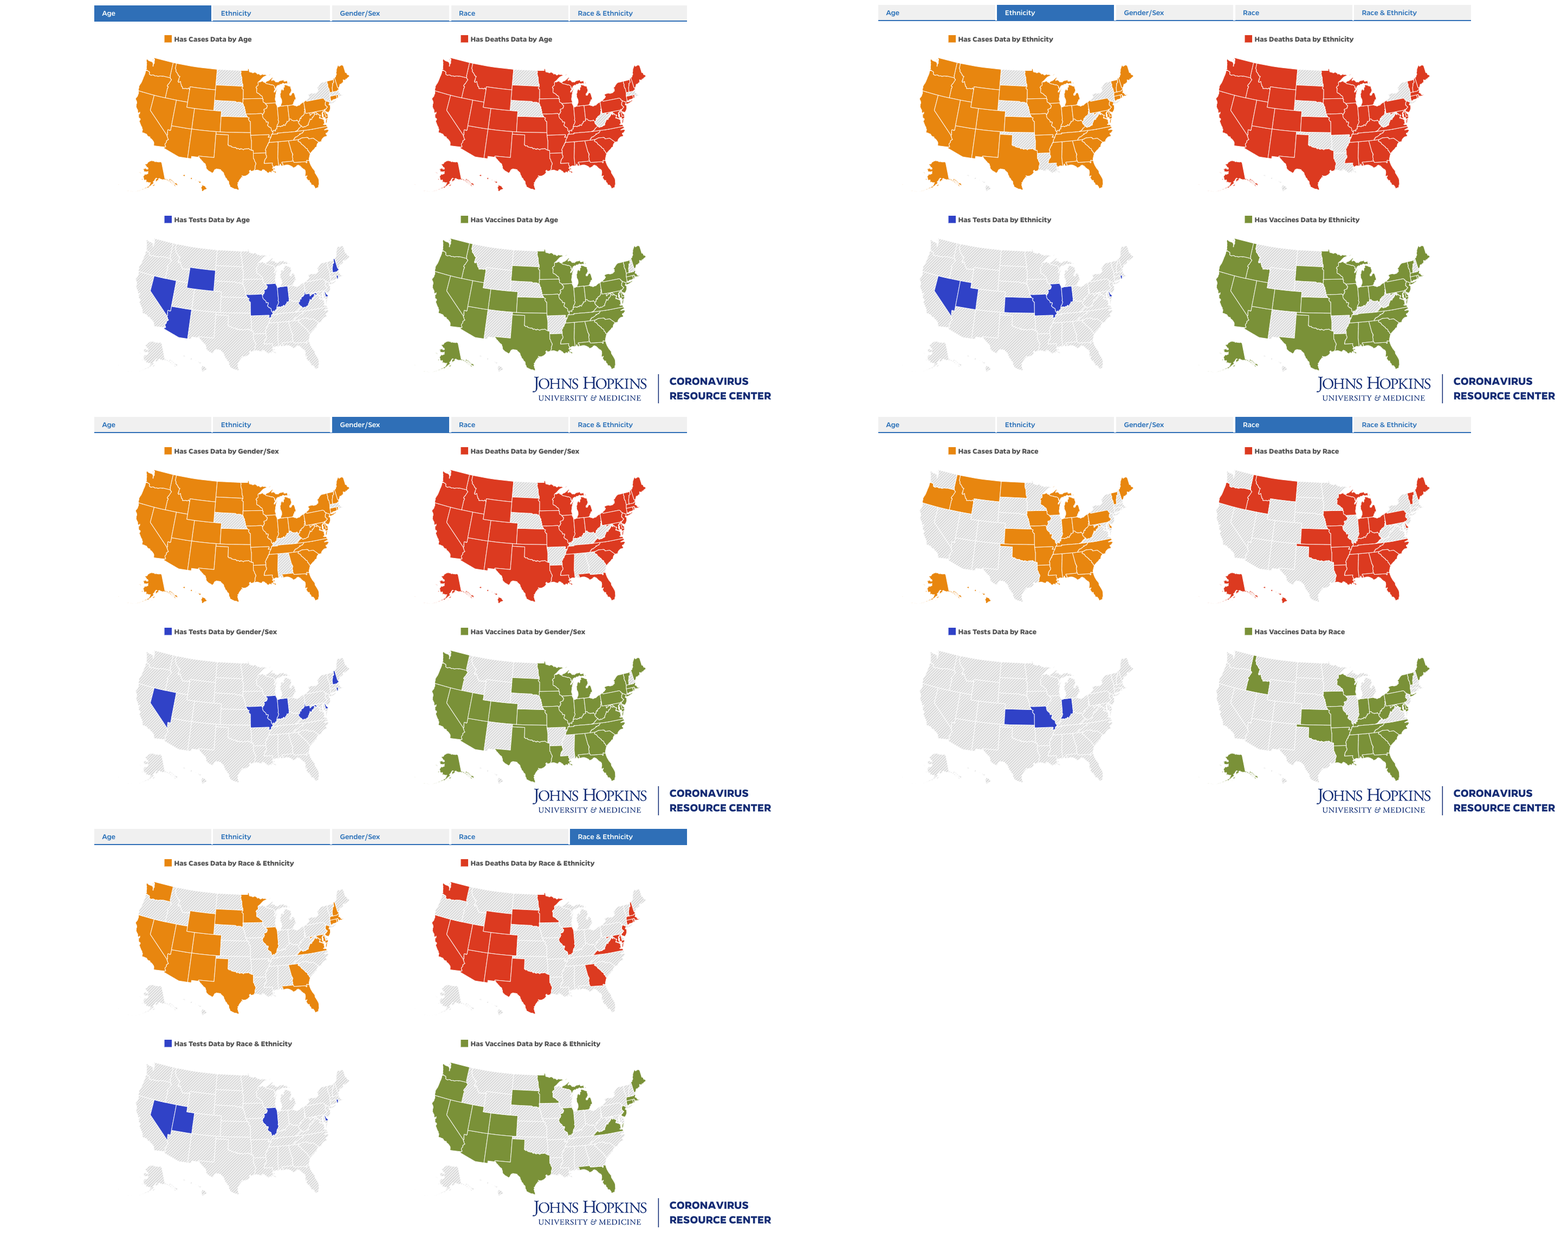
The Johns Hopkins Coronavirus Resource Center today released demographic data and new tools to show the impact COVID-19 has had across the United States as measured by age, race and ethnicity, and gender and sex.
The 7,700 data points collected and processed each month from 55 U.S. states and jurisdictions provide one of the most detailed demographic portraits for cases, deaths, tests, and vaccinations. The new visualizations offer the ability to dissect how COVID-19 has hit various populations and to see the disparate impact inflicted upon minority populations.

Image caption: Demographic data from the Johns Hopkins Coronavirus Resource Center helps users visualize the tragic consequences of COVID-19 in the U.S. by age, race and ethnicity, and gender and sex.
For example:
- Hispanic and Latino residents make up 39% of California's population but comprise more than half of all cases and nearly half of all deaths in the state
- In Washington, D.C., Black residents make up 45% of the population but 76% of COVID-19 deaths
- COVID-19 cases across the nation are evenly split between men and women, but women are getting vaccinated at a higher rate while men are dying more often
"We now have demographic data to help visualize the tragic consequences COVID-19 has been inflicting upon Black and brown communities across the nation since the state of the pandemic," said Beth Blauer, associate vice provost of Public Sector Innovation at Johns Hopkins, and the CRC's data lead. "This emerging data is critical for determining where best to target public health resources, more testing, better treatment, and expanded vaccine education and vaccinations."
The team of data scientists at the Coronavirus Resource Center spent months devising and applying a process for unifying and standardizing demographic data to allow for comparisons among states and jurisdictions whose collection and labeling methods lack uniformity.
Some states report "race and ethnicity" and "gender and sex" as combined categories while others report each separately. Some states do not report demographic details for deaths while others do not report ages, races, and ethnicities for cases. And some states do not provide any demographic details for testing data while less than half report Hispanic or Latino for cases, deaths, or vaccines.
The CRC is a continuously updated source of COVID-19 data and expert guidance. Experts aggregate and analyze the best data available on COVID-19—including cases, testing and contact tracing, and vaccines—to help the public, policymakers, and healthcare professionals worldwide respond to the pandemic.
Posted in Health, Science+Technology
Tagged data visualization, coronavirus, covid-19, covid-19 vaccine, coronavirus resource center


