A team of engineers, epidemiologists, and physicians from Johns Hopkins' Whiting School of Engineering, Bloomberg School of Public Health, and School of Medicine today launched a new smartphone app that analyzes users' body temperatures in a study to predict geographical areas at risk for outbreaks of the novel coronavirus, giving public health experts and government officials critical information to inform decisions on mitigation, resource allocation, and deconfinement.
The study relies on users recording their body temperatures, as well as other symptoms, daily. The free app is available under the name "COVID Control" on Google Play and in the Apple App Store.
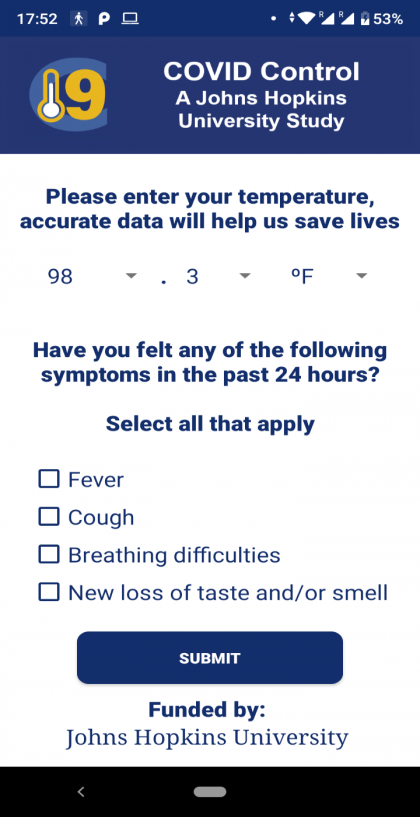
Image credit: Courtesy of Ralph Etienne-Cummings
"Recording and mapping daily temporal fluctuations in temperature and symptoms could be critical in identifying trends that could signal emerging disease flares," said team member Robert D. Stevens, an associate professor of anesthesiology and critical care medicine and neurology and associate director of the Precision Medicine Center of Excellence for Neurocritical Care at the Johns Hopkins School of Medicine. "Because we will be getting this information before people will be seeking health care, this can aid the deployment of resources in a time-sensitive manner."
The team created COVID Control using advanced spatial analytics and machine learning to compare national body temperature records during previous flu trends—provided by health care facilities and regional governments—to identify atypical spikes in regional body temperatures. The group is particularly focused on body temperatures because fever is one of the common symptoms displayed by individuals who show symptoms of the virus. It is estimated that fevers can occur in one-half to two-thirds of people with symptomatic COVID-19.
"Data from this app will allow us to map and identify hot spots of fevers across the United States, potentially indicating emerging outbreaks of COVID-19 before health care or testing is sought," said team member Frank C. Curriero, a professor in the Department of Epidemiology and director of Spatial Science for Public Health Center at the Bloomberg School of Public Health. "That information can be key in our efforts to control and mitigate the spread of the virus."
The group's goal is to reach a large sample of the population nationwide. Anyone older than age 13 who has access to a thermometer and a smartphone can contribute. Importantly, with the group aggregating data across regions for analysis, a participant's individual data will never be shared.
One aim of the group was to make the app as easy to use as possible. After participants take their temperature with a thermometer, developers believe it will take fewer than 10 seconds to submit their data to the app.
"Our hope is that the app's user friendliness will set it apart from others that have been developed in response to COVID-19, which require a long questionnaire, typically many pages, to be answered by users," said Ralph Etienne-Cummings, chair of the Department of Electrical and Computer Engineering and director of the Computational Sensory-Motor Systems Laboratory. "Our view is the longer the questionnaire, the less likely the individual will finish it. Also, the less likely the individual will want to participate every day. We need a large cohort to remain engaged with the study for it to be most effective at tracking and predicting emerging COVID clusters, hence the simpler information submission system."
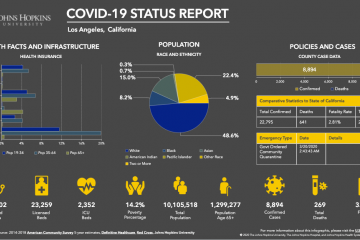
Another noteworthy feature of the app is that it allows users to view results via a dashboard of analytical maps, which are updated daily and reveal not only the number of users contributing information but also how many are reporting fevers and other symptoms in a given county. The maps also show results from the group's cluster detection analysis with identified hot spots of symptoms.
The maps generated by this data are available to the public on both the mobile app and its website, allowing people who are not participating to also have access to the system's daily findings.
"As an intensive care physician, I believe that one of the most important contributions we can make in the fight against this pandemic is to go upstream and create measures that will prevent people from developing the critical illness in the first place," said Stevens. "One way to achieve this is to leverage the power of high-resolution data that are captured via sensors and portable devices such as smartphones."
For Curriero, this app is a combination of Johns Hopkins' many strengths, and highlights why it is one of the organizations leading the fight against COVID-19.
"Johns Hopkins is populated with so many talented faculty, students, staff, and medical professionals," Curriero said. "Being able to tap into that pool of expertise can lead to unique collaborative efforts, and that perspective is our 'Hopkins advantage' in facing public health challenges."
Stevens and Curriero lead the project with Etienne-Cummings. The system's development was completed by Amparo Güemes, Soumyajit Ray, Khaled Aboumerhi, and John Rattray—PhD candidates from Etienne-Cummings' lab—while spatial epidemiologists from the Spatial Science for Public Health Center—Timothy Shields, Anton Kvit, Brendan Fries, Anne Corrigan and Michael R. Desjardins—provide the data analytics.
Posted in Health, Science+Technology
Tagged epidemiology, electrical and computer engineering, coronavirus, covid-19