Public school officials across the United States require better data to help them navigate the third school year disrupted by a pandemic that could continue to threaten learning for much longer, according to experts who participated in the Johns Hopkins Pandemic Data Initiative expert forum last week.
During the event on Friday, leaders from the Johns Hopkins Coronavirus Resource Center and the eSchool+ Initiative highlighted datasets that provide demographic details, including ages, of COVID-19's impact and that detail the policies schools have implemented.
The state-by-state data presentation and the school district policy analyses available through both websites aim to provide a vital—but largely missing—localized view of how the pandemic has impacted public education in the United States.
The CRC's demographic data had not been provided in such a refined way before, said Beth Blauer, associate vice provost for public sector innovation and the Coronavirus Resource Center's data lead.
"The data had been impeding the way that school administrators were able to respond to the disease because we had aggregated data that was telling a very homogenous view of the way the outbreak was manifesting in communities," Blauer said. As more state and local government agencies provide COVID-19 data to schools, "that can really help with public policy making."
Schools already generate and deliver significant amounts of data to local, state, and federal government agencies about metrics such as attendance and over-the-counter medications that help determine if disease are present or emerging, Blauer said.
"But COVID posed a very different kind of challenge," she said. "We need data to come from state and local communities and also the federal government into schools so that they could navigate some of the toughest decisions that they've had to navigate in a generation."
Those decisions have included how to implement in-person, virtual, or hybrid teaching systems, how to enforce physical distancing, and whether to impose mask mandates.
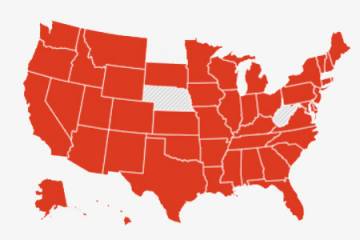
The Coronavirus Resource Center last week launched a new section that provides state-by-state breakdowns of cases, deaths, tests, and vaccinations by the demographic categories of age, race and ethnicity, and sex and gender. The age range of 10-19 represents the largest proportion of school-age children. And with the information, for example, users can see that those children make up 9.7% of cases in California, 0.46% of deaths, and nearly 10% of vaccinations.
"It's critically important for us to have this data," Blauer said. "Why? We need to understand this data in detail so we can give superintendents of school systems and principals the information that will allow them to guide the decisions that will keep their school communities safe."
But there are significant problems with the data. It is incomplete and lacks standards. Each state reports the demographic breakdowns differently because there are no federal standards for such reporting—a universal data issue that led the CRC to launch the Pandemic Data Initiative in May.
"We're encouraging all states and local jurisdictions to be thinking about the ways that they use demographic data to really advance their public health strategies in particular communities," Blauer said during last week's forum. "And this is going to be a challenge because there are no standards here. This is another area where there's a clear lack of standards around how we collect demographic data and how we share that data."
Blauer was joined by Annette C. Anderson, a team lead for the schools+ Initiative and the deputy director of the Center for Safe and Healthy Schools; William Moss, executive director of the International Vaccine Access Center; and Michael Hinojosa, superintendent of the school system in Dallas, Texas.
Anderson's teams have spent much of the past year building a suite of datasets that provide educators in the United States and around the world with detailed information on how school districts have responded to various pandemic related issues.
"One of the most pressing issues around reopening schools was what data schools needed to have in order to know whether or not schools were prepared and able to open safely and in a healthy way," Anderson said during the forum. The initiative offers multiple visualizations that provide a national view of the disparate steps states have taken on a number of issues:
- The school reopening tracker curates school reopening plans by state and provides guidance documents for best practices focused on six operational criteria (such as core academics, access and transportation, and food) and six ethics-and-equity criteria (such as children with special needs, children living in poverty, and parent choice)
- The teacher and school staff vaccination dashboard tracks the availability of vaccinations for teachers and school staff across the United States
- The COVID-19 Global Education Recovery Tracker monitors the pandemic's impact on response and recovery for students around the world and is the result of a partnership with the eSchool+ Initiative, the World Bank, and UNICEF
"Only 16 states when we first started tracking the reopening plans addressed all 12 of the categories in their plans" at the end of the 2019-20 school year, Anderson said. "By the time schools opened in the fall of 2020, we saw that the number had double to more than 30 states addressing all 12 of the categories measuring operational as well as equity-focused issues."
The categories that were most frequently missing in the reopening plans included consideration of parent choice, teacher choice, staff choice, and also children of poverty and systematic disadvantage, she said.
Significant research is required to pinpoint the best data about "the children who were out of school, out of learning, out of engagement," Anderson said.
"We suspect that about 3 million children over the course of the 2020-2021 school year at some point missed some of their academic instruction," she added. "And so, trying to look at what that means for our most vulnerable children and how it opens up this equity gap has been a significant interest of ours."
Hinojosa added that such data has been critical in effectively managing the Dallas Independent School District—a school district he described as being, politically speaking, a "blue city in a purple county in a red state."
"Superintendents have been hung out to dry at this time," he said. "People are using different data to tell us what kind of decisions we need to make."
He let the rising number of cases in Dallas that he tracked with Johns Hopkins data inform his decision to impose a mask mandate across the second largest school district in Texas and the 16th largest in the United States—despite a governor who had prohibited mask mandates.
"We implemented the mask mandate against the direct executive order of the governor," Hinojosa said. "It was based upon data. Johns Hopkins is a trusted institution, and I had to make these decisions based on everything," especially the data.
Hinojosa also sidestepped the state prohibition against vaccination mandates by letting staff and students decide—with a bit of an incentive.
"We incentivized the behavior that we wanted," he said. "We told people we'd give you $500 if you can prove you've been vaccinated and within two hours, 6,000 of our educators out of 22,000 gave us their documentation. Since we started that we are up to 75% of our employees, including bus drivers and food service workers, who have given us documentation that they've been vaccinated."
He also offered a $50 gift card to students who were vaccinated.
In addition, Hinojosa prepared for the return of students who may still be suffering mental health problems related to losing relatives and friends to COVID-19 and who struggled amid the isolation of virtual learning.
"We anticipated the need for behavioral health issues," he said. "We hired 58 mental health and social work professionals" before the school year started.
Moss has praised incentives for vaccines for months and has questioned why state officials would try to prevent local school officials from implementing policies they deemed best for their students and staff—especially since most schools already have such high compliance with mandatory routine vaccinations.
"Ninety-five percent of all our kindergarten students in this country are vaccinated with the standard routine of vaccines and this is because each state has requirements," he said. "Only about 2.5% of students have any kind of exemption from those standard vaccines."
He said governments need to collect the same data—lwho is vaccinated, who isn't—for COVID-19 vaccinations.
"We need to have very accurate, detailed, granular data at the level of the schools so that school leaders can assess their risks," Moss added.
Posted in Health, Science+Technology, Politics+Society
Tagged education, data visualization, covid-19, coronavirus resource center