- Name
- Jill Rosen
- jrosen@jhu.edu
- Office phone
- 443-997-9906
- Cell phone
- 443-547-8805
Bridges in New York, California, and Georgia are among United States bridges with the most traffic from the largest ships, according to a new and unprecedented data mining effort, the first step in an urgent assessment of the nation's bridge vulnerability following last spring's Key Bridge collapse in Baltimore.
"We're asking, 'What is the probability of a very large ship taking out another bridge?' and to get at that question, the first thing we have to do is understand the actual ship traffic under major bridges across the U.S.," said Michael Shields, a Johns Hopkins University engineer specializing in risk assessment and lead investigator of the National Science Foundation-supported study.
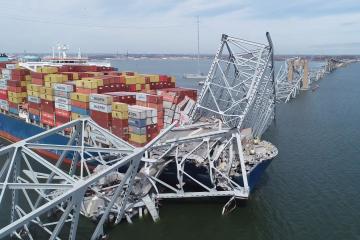
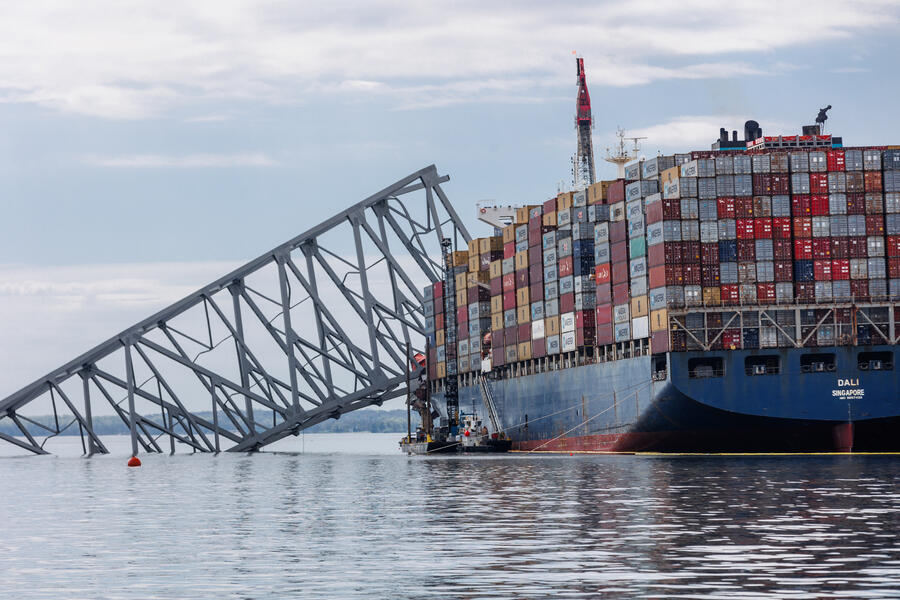
Six months ago this week, the Francis Scott Key Bridge collapsed after a direct hit by a massive container ship. Believing chances are high for another such incident, and that risk to the Key Bridge amid modern shipping traffic had been underestimated, Johns Hopkins engineers immediately began an effort to modernize risk assessment models for U.S. bridges.
With better understanding of the most vulnerable bridges, the team hopes decision-makers can strategically direct safety investments to bridges most in need.
"This traffic data suggests a relatively small number of bridges see a disproportionate amount of the largest ship traffic," Shields said. "It's very clear where the heavy traffic is happening and these bridges should be prioritized for more careful and rigorous risk analysis."
To determine which bridges have the most large-ship traffic, the team collected and mined six years of U.S. Coast Guard data—logs detailing the precise location, heading, speed, and status of every ship traveling through the country's waters on a minute-by-minute basis. They cross-referenced the geolocated shipping information with port data and bridge data from the National Bridge Inventory to determine which large ships passed under bridges.
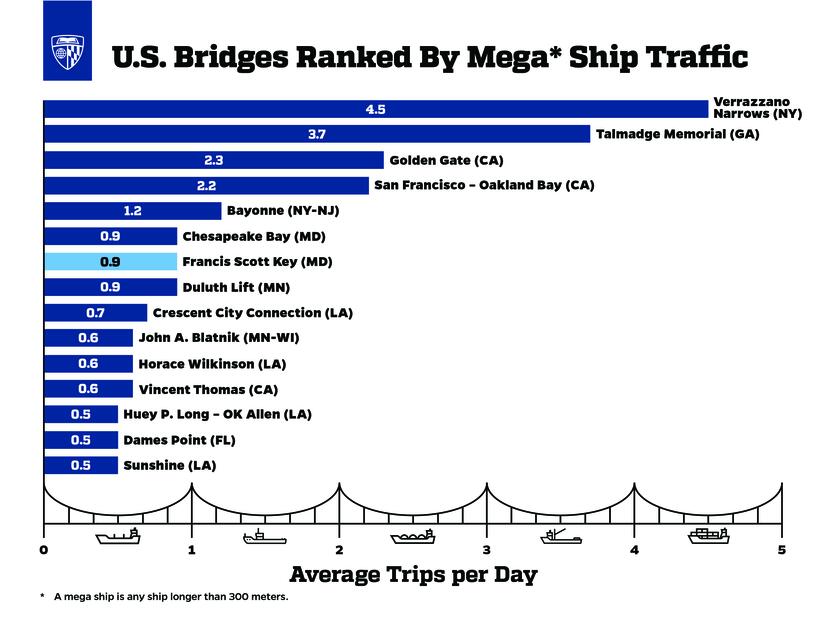
Image credit: Khamar Hopkins / Johns Hopkins University
They then built a novel program to analyze this massive data set to assess large-ship traffic under more than 200 major U.S. bridges.
"Until the Key Bridge collapsed, there wasn't a significant impetus to ask how many large ships pass under these enormous bridges," Shields said. "Nothing like this has been done on a national scale."
The Verrazzano-Narrows Bridge in New York City, the Talmadge Memorial Bridge in Georgia, and two San Francisco Bay Area bridges topped, by far, the list of bridges with the most traffic from the very largest ships. Bridges with the most traffic from large (but not necessarily the very largest) ships include Houston's Fred Hartman Bridge and several bridges along the Mississippi River including the Crescent City Connection in New Orleans. Meanwhile, the Francis Scott Key Bridge ranked among the top 10 bridges in very large ship traffic, with on average one ship longer than 300 meters (the size of the Dali) passing under it per day.
Shields cautioned that high ship traffic doesn't necessarily mean a bridge is at high risk for collisions. Local shipping channel conditions, along with existing shipping safety practices and individual bridge protections can play an important role.
The team's full traffic analysis is available for download at https://bridgerisk.engineering.jhu.edu. The site includes traffic trend data for more than 200 bridges. Results will be regularly updated.
As they continue their work to determine which bridges are most vulnerable to collisions, the team will next determine how frequently ships that pass under these bridges stray off course. That will allow them to determine the aberrancy rate for ships in the U.S., and the aberrancy rate near highly trafficked bridges.
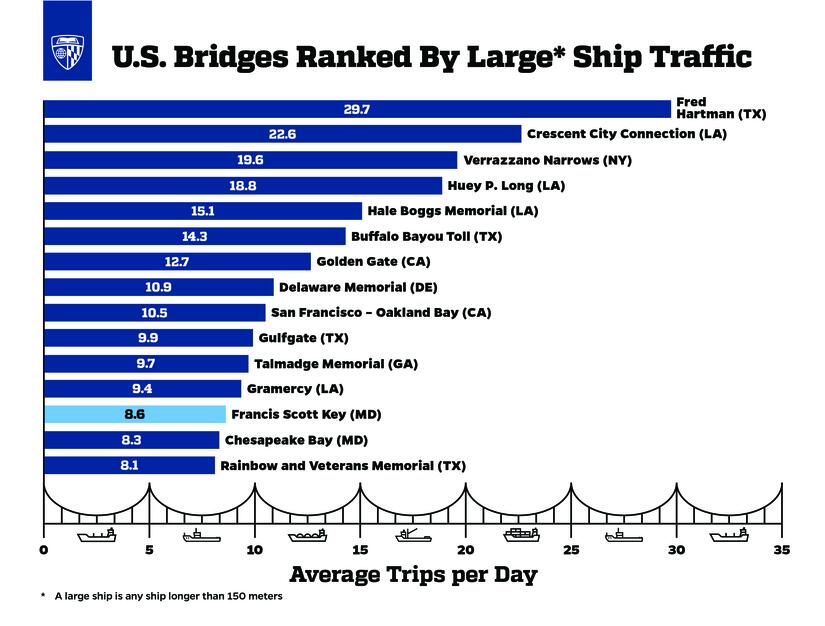
Image credit: Khamar Hopkins / Johns Hopkins University
They will look closely at the Key Bridge to determine what the ship traffic and aberrancy rate suggested about the likelihood of that collision.
"Was it an exceedingly rare event that couldn't have been predicted," Shields said, "or not as surprising as we might have thought?"
The team expects to release further findings in 2025.
The team included structural engineer Ben Schafer, the Willard and Lillian Hackerman Professor; Rachel Sangree, a structural engineer with bridge inspection experience; Promit Chakroborty and Damir Akchurin, PhD students in Civil and Systems Engineering; Johns Hopkins undergraduate and master's students Diran Jimenez, Natalia Dougan, Yile Wang, Jenna Halpin, and Diana Arizmendi; and Morgan State undergraduate Esther Ezeigbo.
Posted in Science+Technology
Tagged transportation, data modeling, civil engineering, infrastructure, national science foundation