

Beth Blauer is executive director of the Centers for Civic Impact at Johns Hopkins. She and her team transform raw COVID-19 data into clear and compelling visualizations that help policymakers and the public understand the pandemic and make evidence-based decisions about health and safety. This op-ed originally appeared on the Johns Hopkins Coronavirus Resource Center website.
Throughout our work at the Coronavirus Resource Center, we have highlighted that state reporting methods for COVID-19 testing, hospitalization, death, and vaccination data are limited by lack of standardization and accessibility. These challenges only worsen when the data is broken into a dizzying number of demographic subcategories. Further complicating the matter, states often only provide demographic data in an aggregated form, preventing local governments and the public from accessing detailed demographic information for their areas.
Why is demographic data important?
With access to detailed demographic data, local governments would be equipped to design targeted outreach programs and deploy mobile vaccination units to locate and assist their most vulnerable residents. This information would also inform policy decisions of city and county leaders by more accurately identifying hotspots, opportunities to invest in public health assets, and track outbreaks in near real-time. Additionally, because COVID-19 is still a relatively new virus, making detailed demographic data publicly available would help the scientific community better understand how the virus spreads and which people are most impacted by infection. This could help with the design of new therapies and better prepare public health professionals for future viruses and variants.
What are the problems?
There are two major issues with COVID-19 demographic data:
- Detailed demographic data from states is not accessible to the public and local governments
- Demographic categories and definitions differ between states
Exacerbating these challenges, state demographic data is often released in the form of charts or PDF reports, which contain aggregated data and lack individual detail necessary for accurate analysis. This bare-bones, aggregated data often is stored in hard to reach places, recorded manually in assorted reports, press releases, and even images. This manual data collection process requires significant work, unlike other data streams whose collection has been automated due to the format and accessibility of data. Releasing raw, individualized COVID-19 demographic data from which the states calculate these aggregates would remove the need for manual data collection. Publicly releasing the data would also allow county and city-level officials and public health workers to access and utilize this granular demographic information.
More concerning is the fact that the data is so disparate it's essentially impossible to compare between states. There are no standards for categorizing demographic data, so individual decisions to label categories with similar but different names, such as "Hawaiian" vs. "Hawaiian/Pacific Islander," complicate the data. There are currently 1,098 different demographic categories reported by the U.S. states and territories, which is an unmanageable quantity. This description of data disarray does not even include testing, hospitalization, or cross-categorization metrics, such as "white women aged 30-45," which would add thousands more categories.
There are even discrepancies within the same state. In Georgia, the demographic age categories on the state COVID-19 dashboard do not match the age categories on the state vaccination dashboard. A 60-year-old Georgia resident would be in the 60-69 age demographic group for a COVID-19 case, but in the 55-64 age group for their COVID-19 vaccination. This one person has already contributed data to two separate demographic pools, before accounting for sex, ethnicity, and race.
How are these issues manifested in the data?
CRC data scientists have visualized the plethora of demographic categories as tree maps. Each box in the map represents a distinct demographic category and its size is proportional to the number of times that label is used across states.
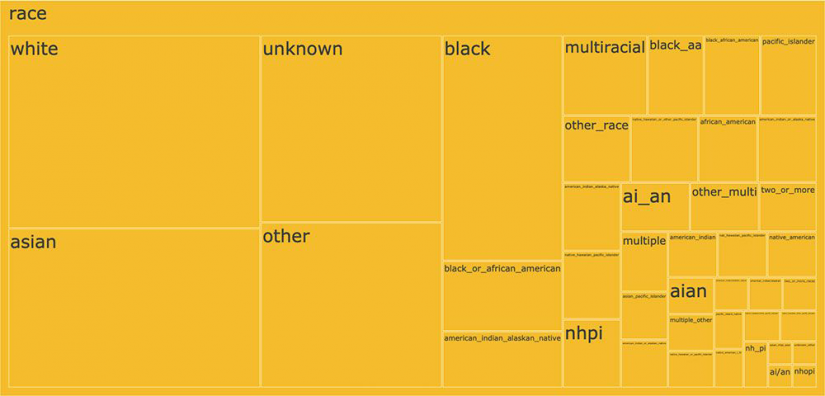
Image caption: Each box in the tree map represents a distinct demographic category currently used in coronavirus reporting. The box's size is proportional to the number of times that label is used across states.
Racial data is the most complex and convoluted of all the demographic data even though the U.S. Office of Management and Budget only mandates five race categories. Instead, there are over 40 unique demographic categories of race reported within state vaccination data alone. While America is a melting pot where many people have rich, diverse ancestries, there are mathematical and scientific benefits to grouping the data into a reasonable number of consistent categories. A person who is "Middle Eastern" should not become "Asian" when they cross one state border and "White" when they cross another. This lack of data uniformity makes race-based analysis of COVID-19 trends virtually impossible.
What can we do to fix it?
The good news is the data exist. States could release the raw data publicly to allow for better demographic analysis. The data can and should be disaggregated, randomized, individualized, and anonymized. While privacy is not a major concern in a data set this large, it is important to proactively protect individual anonymity while pursuing data analysis to protect the country. These data should be easily accessible, machine-readable, regularly updated, and centralized so that policymakers and the public can make informed decisions and identify risks in near real-time.
As the country moves forward in this pandemic and prepares for the next public health crisis, demographic categories need to be standardized. The United States does not have federal standards for public health data categorization, but state health departments could agree to follow one example, such as that of the Census Bureau or the Office of Management and Budget, which overlap and have been thoroughly vetted in a bipartisan manner. Standardizing and releasing these data streams should be a national priority.
Posted in Health, Voices+Opinion, Politics+Society