

- Name
- Jill Rosen
- jrosen@jhu.edu
- Office phone
- 443-997-9906
- Cell phone
- 443-547-8805
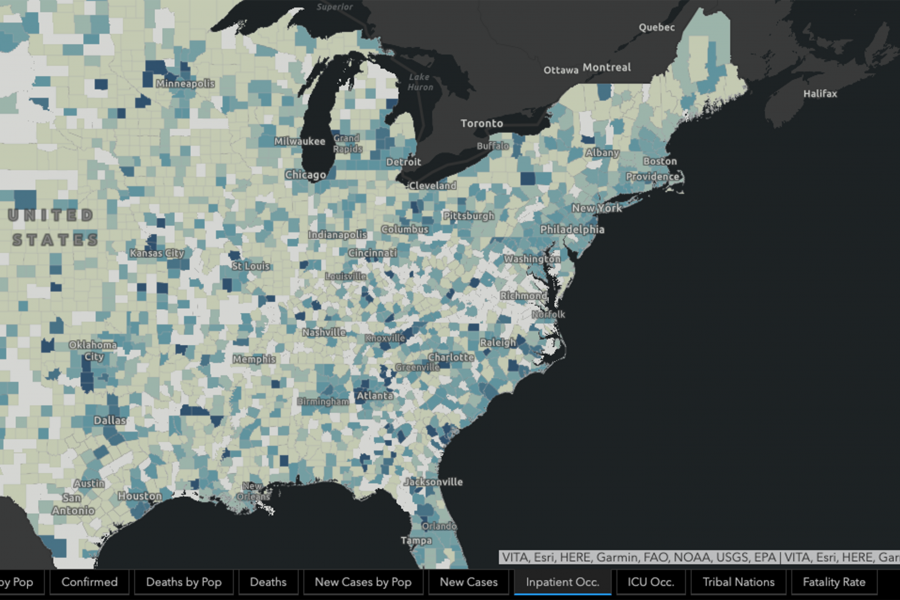
To offer perspective on how the nation's hospitals are managing the surge of COVID-19 patients, the Johns Hopkins University Coronavirus Resource Center is now tracking county-level hospital occupancy data, with fresh updates every day.
On the center's United States COVID-19 map, viewers can toggle to two new pages for daily updates on both overall hospital occupancy and ICU occupancy. Both maps display the most up-to-date information on hospital ICU occupancy rates in the U.S. The data is sourced from the Department of Health and Human Services.
On each map, the darker the county is shaded, the closer it is to reaching hospital capacity.
When used in tandem with the U.S. map's county-level demographic data that includes the total number of hospital beds and ICU beds available per county, the new maps indicate the ability of local hospitals to manage local caseloads.
The Johns Hopkins Coronavirus Resource Center is a continuously updated source of COVID-19 data and expert guidance. Experts aggregate and analyze the best data available on COVID-19—including cases, testing, and contact tracing—to help the public, policymakers, and health care professionals worldwide respond to the pandemic.
Posted in Health
Tagged data visualization, coronavirus, covid-19