Skip to main content
Menu
Hub
Open Hub
About the Hub
Announcements
For Media
Faculty Experts Guide
Subscribe to the newsletter
Explore by Topic
Arts+Culture
Athletics
Health
Politics+Society
Science+Technology
Student Life
University News
Voices+Opinion
Events
At Work
Open At Work
About Hub at Work
Gazette Archive
Explore by Topic
News+Info
Benefits+Perks
Health+Well-Being
Tools+Tech
Happenings
Johns Hopkins Magazine
Open Johns Hopkins Magazine
Current Issue
About the Magazine
Past Issues
Contact
Support Johns Hopkins Magazine
Subscribe to the Magazine
jhu.edu
Search
Archived articles
Data visualization
New COVID-19 dashboard helps users make informed decisions regarding hospital care
Published
Feb 18, 2021
The tool visualizes hospital acute care and ICU capacity and provides information on hospital transfer procedures
COVID-19
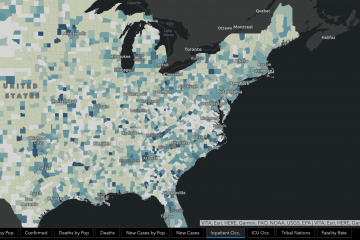
County-level hospital, ICU occupancy data added to national tracker map
Published
Dec 15, 2020
The data is sourced from the U.S. Department of Health and Human Services and adds to the scope of data visualization options the JHU Coronavirus Resource Center provides
Data visualization
New tools added alongside COVID-19 tracking map
Published
April 9, 2020
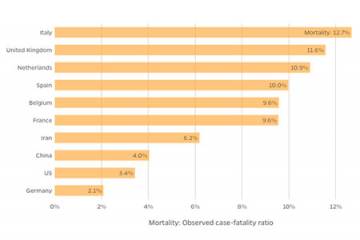
Collaborative project examines trends including new infections, cumulative cases, mortality rates, and other data
InHealth
Data diagnostics
Published
May 23, 2016
Course challenges students to determine diagnoses, tailor health care without expensive testing
Previous